Ethereum Bull Tom Lee Backs 3,000% ETH Upside Case

Fundstrat co-founder Tom Lee shared a “generational play” thesis for Ethereum that predicts 3,000% upside in Ether (ETH) price to $60,000.
Key takeaways:
ETH is testing a key long-term support trend line that preceded 5,000% gains in the past.Tom Lee amplified the fractal setup, which projects ETH toward $60,000 by 2030.
ETH price chart: Giant ascending channel targets $60,000
On Wednesday, Lee reposted a bullish outlook shared by analyst Crypto Patel that predicted ETH’s price reaching $60,000 in the coming years.

The setup showed a long-term ascending channel that has framed ETH’s price action since 2017, with its upper and lower trend lines repeatedly acting as resistance and support across multiple market cycles.
ETH/USD two-week chart. TradingView/CryptoPatel
In 2020, for example, ETH rebounded from the channel’s lower trend line before rallying roughly 5,200% toward the upper boundary, where the cycle eventually topped.
Again, as of late April, ETH’s price stabilized around the lower trend line, an “accumulation zone” spanning $1,300–$2,000.
Patel highlighted a potential multi-year price rebound in the making, calling it a “generational play” for “patient holders.” His chart projected a 1,000% rise in ETH to around $15,800 by 2028 and 3,150% to $60,000 by 2030.
Related: These 3 Ethereum metrics favor an ETH price rally to $6K
Lee reposted Patel’s bullish outlook after BitMine, the Ethereum treasury firm he chairs, purchased $235 million worth of Ether, lifting its net Ether reserves above 5 million ETH, or roughly 4% of the current Ethereum supply.
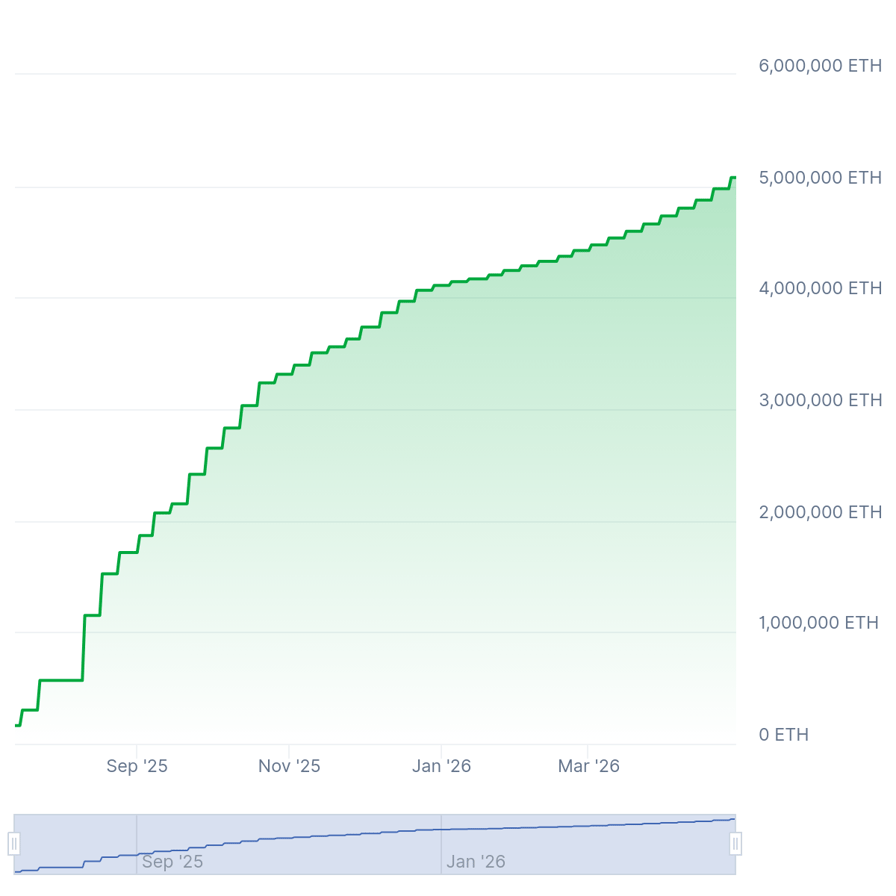
BitMine’s Ethereum holdings chart. Source: CoinGecko
The buying spree underscores BitMine’s aggressive ETH accumulation strategy, even as the company remains exposed to sharp market swings. As of late April, its unrealized losses on the investments stood at around $6.5 billion.
Ethereum bears will have other plans
Since 2021, Ether has traded inside a giant symmetrical triangle, a neutral pattern that can break in either direction. It briefly moved above the structure in July 2025, but the breakout failed, sending the price back inside the range.
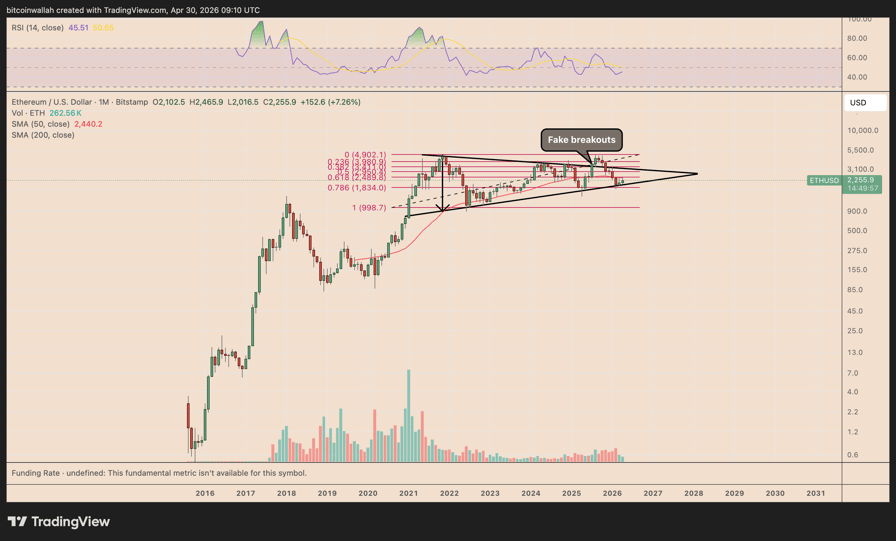
ETH/USD weekly chart. Source: TradingView
A decisive breakdown below the lower trend line, now near the 0.786 Fibonacci retracement around $1,834, would weaken the bullish case.
Losing this support could open the door to a deeper decline toward the 1.0 Fib line at around $1,000, aligning with downside targets flagged by several bearish analysts earlier this year.
In this case, BitMine could see its unrealized loss swell to roughly $13.2 billion, based on an estimated average ETH acquisition cost of around $3,600 across its holdings until April.
Still, longer-term Ethereum forecasts remain optimistic, with VanEck and Standard Chartered projecting upside targets of up to $22,000 and $40,000, respectively, in their more bullish scenarios.