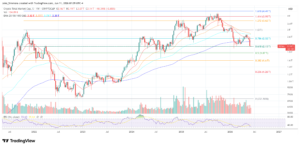
Bitcoin is repeating a 2022 pattern

CryptoQuant’s latest Apr. 30 read shows that perpetual futures are driving Bitcoin’s recovery, while spot demand is still shrinking. That is the same market structure seen during the 2022 bear market rallies, when leverage-driven rebounds gave way to fresh downside.
Spot buying through exchanges, ETFs, or direct on-chain accumulation represents committed capital. At the same time, perpetual futures allow traders to take directional exposure with borrowed capital, often at multiples of their collateral, without holding the underlying asset.
When both forms of demand expand together, a rally tends to be self-reinforcing. When futures lead and spot lags, leveraged traders finance the bounce and face forced exits if the price moves against them.
The 2022 comparison
Several bear-market rallies in 2022 shared the same regime, with perpetual futures demand recovering before spot demand did. The price bounced, and leveraged positions came off as spot buyers proved too thin to absorb the selling.

The bounces looked constructive, but each one resolved into the next leg lower.
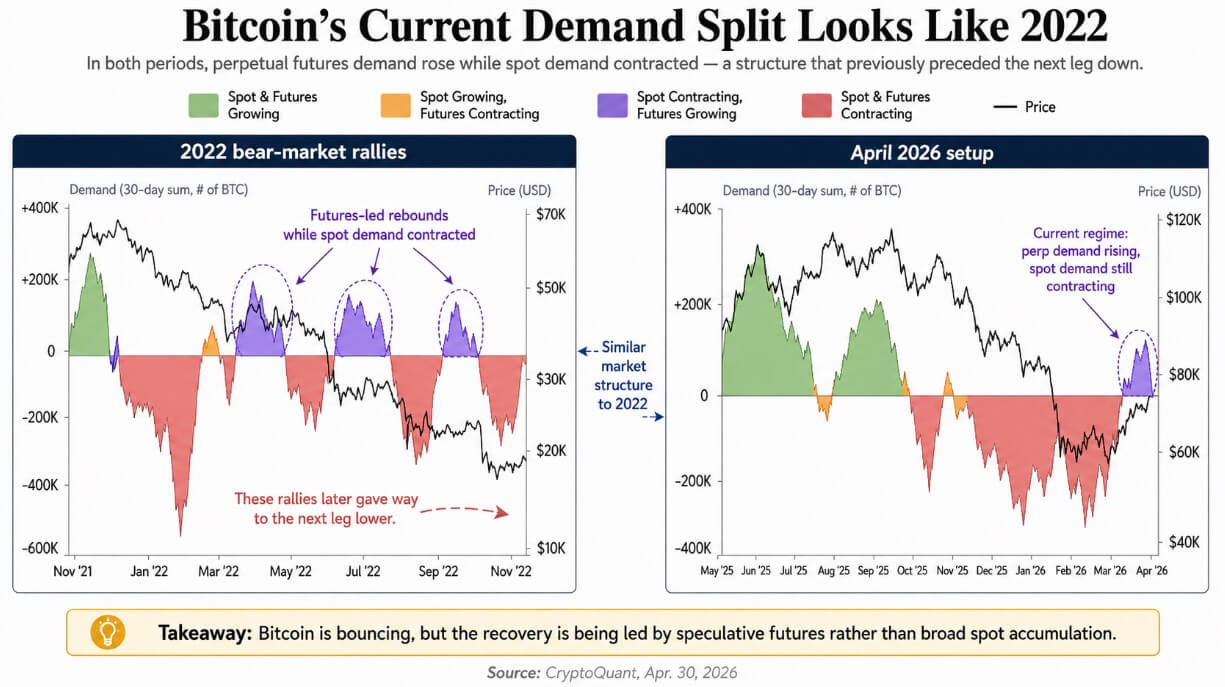
CryptoQuant’s chart places Bitcoin’s current April 2026 move back into a regime where spot contracts are contracting while futures contracts are expanding. The parallel is that borrowed capital is reappearing before real cash demand does, which is precisely the condition that made 2022’s failed rallies fragile.
The scale of today’s futures market makes that fragility a larger variable. CoinGlass data showed $47.64 billion in 24-hour Bitcoin futures volume versus $4.07 billion in spot volume, a ratio of about 11.7x, with open interest at roughly $54.19 billion as of Apr. 30.
Perpetual futures can involve borrowed capital up to 50 times the collateral on some platforms, meaning relatively small price moves can trigger large forced liquidations.
When spot volume runs at $4 billion a day and a long-side flush starts, the market’s depth gets tested fast.
What the ETF data adds
US spot Bitcoin ETF flows have recently reinforced the market structure warning, as Farside Investors data shows aggregate outflows of $490.5 million between Apr. 27 and Apr. 29.
The ETF bid has gone choppy at exactly the moment futures positioning is expanding, while the long-run ETF picture holds its shape.
MetricCurrent readWhy it mattersBTC futures volume, 24h$47.64BDerivatives activity is dominating the marketBTC spot volume, 24h$4.07BSpot support is much smaller than futures activityFutures/spot volume ratio11.7xShows the rally is heavily leverage-drivenBTC open interest$54.19BLarge leveraged position base that could unwindUS spot BTC ETF flows, Apr. 27–29-$490.5MRecent ETF demand has turned choppyIBIT cumulative net inflows~$65.2BLong-term institutional demand remains strongTotal US spot BTC ETF cumulative inflows~$58.1BThe structural ETF bid is still positive overall
IBIT alone accounts for roughly $65.2 billion in cumulative net inflows, and the entire US spot Bitcoin ETF category totals about $58.1 billion, numbers that reflect genuine structural buying absent in 2022.
From Apr. 13 to Apr. 29, IBIT still absorbed about $1.47 billion in net inflows, keeping the longer-term institutional picture intact. The near-term read is that the ETF bid is not currently providing clean support for price at a time when futures positioning would most need it.
The bull case
The 2022 analogy breaks when spot demand turns positive before leveraged traders start reducing exposure. CryptoQuant’s apparent demand measure moving back above zero is the cleanest invalidation trigger that spot accumulation confirms the futures-led move.
The structural gap between 2026 and 2022 also gives the bull case a foundation. Bitcoin now has regulated US spot ETFs, deeper institutional infrastructure, and a persistent corporate-treasury bid that did not exist four years ago.
Even CryptoQuant’s Apr. 1 note, which flagged deep contraction in spot demand, acknowledged that ETF and corporate buying had been accelerating.
The bull case runs on those buyers scaling up fast enough to pull spot demand back into positive territory. If ETF inflows resume over a sustained window and the futures-to-spot volume ratio narrows toward the broader market’s 3x reading, the market structure argument weakens on its own terms.
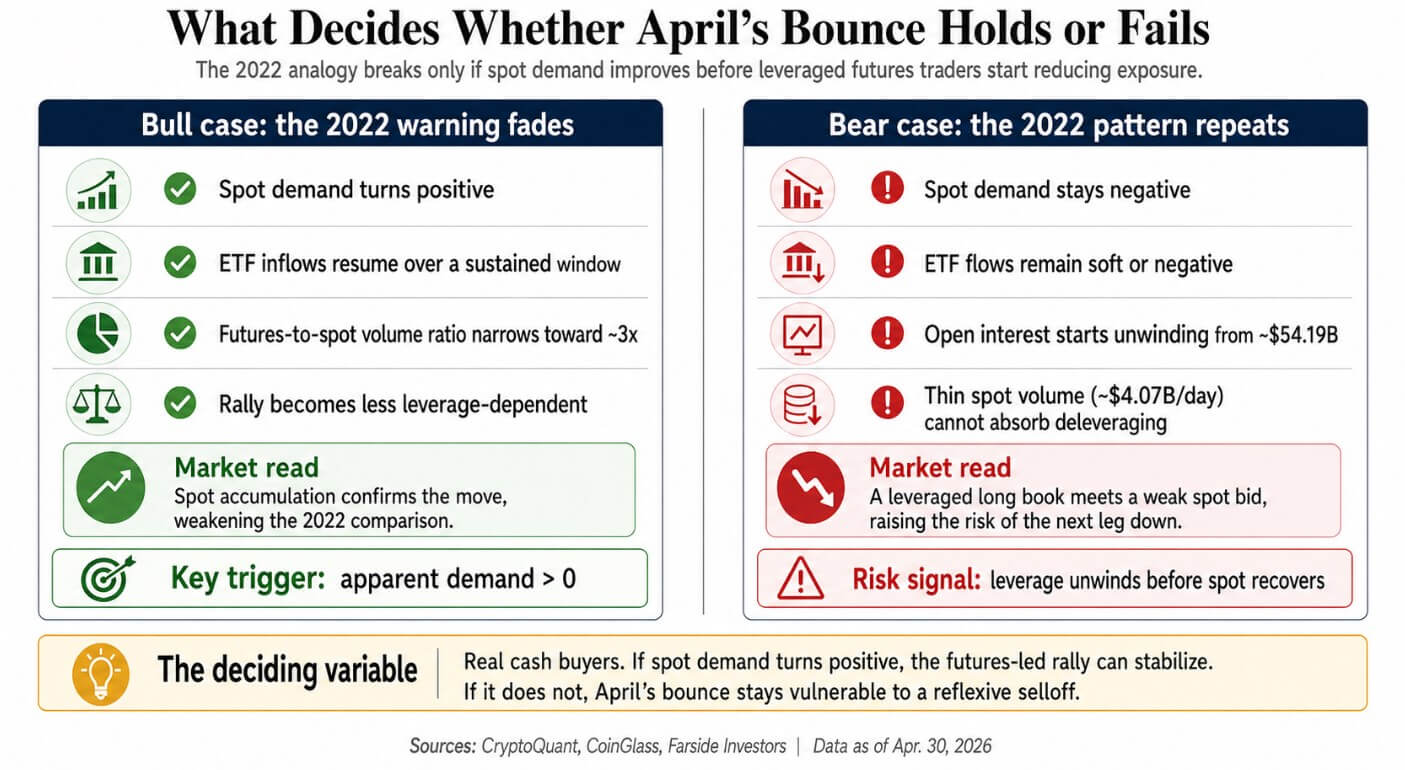
The bear case
The bear case needs only leveraged traders to reduce exposure before spot demand turns positive. It requires only that leveraged traders start reducing exposure before spot demand turns positive.
At $54 billion in open interest, even a partial unwind produces large absolute selling volume, and with spot volume running at roughly $4 billion a day, the market lacks the depth to absorb a rapid unwind without a hard price drop.
The reflexivity compounds the risk, since falling prices push leveraged longs toward liquidation, liquidations press prices lower, and the cycle feeds itself until spot demand deepens enough to hold a floor.
Bear markets end when demand for spot and futures recovers together.
The current setup has futures recovering on their own, and if that condition holds, Bitcoin has reproduced the demand structure of 2022’s failed rallies. The coming weeks of on-chain apparent demand and ETF flow tone will determine whether April’s bounce joins that list or separates from it.
Either real cash buyers step in and validate the futures-led move, or the market finds out what a leveraged long book looks like when the spot bid is too thin to hold the floor.