Mapping The Bitcoin Bottom: Here’s How Low Price Could Go Before It Recovers

Bitcoin (BTC) could be gearing up for further losses, as a crypto analyst has issued a severely foreboding forecast. According to his analysis, Bitcoin’s current structure shows a predominantly bearish trend, with price expected to reach a bottom below $30,000 before any potential reversal to the upside.
Bitcoin Repeats 2022 Style Bear Market
Crypto market analyst Jussy has published a new Bitcoin chart analysis on X, warning that the market may not have reached its final bottom yet. The chart compares the current weekly structure to Bitcoin’s 2022 cycle, showing nearly identical price behaviour following a double top formation and a bear flag that led to a major breakdown.

In 2022, Bitcoin first printed a double top near the upper resistance zone above $60,000. It was then rejected from the rounded top structure, reversing into a sustained downside trend. After this, the price experienced a sharp breakdown, followed by a three-week consolidation phase that developed into a bear flag pattern.
That consolidation acted as a brief pause before a bearish continuation, with BTC ultimately collapsing by another 38.96% from the bear flag range. Consequently, the final leg down erased roughly $11,095, carrying the price into a long-term support zone where the market finally hit a bottom and began to stabilize ahead of a recovery.
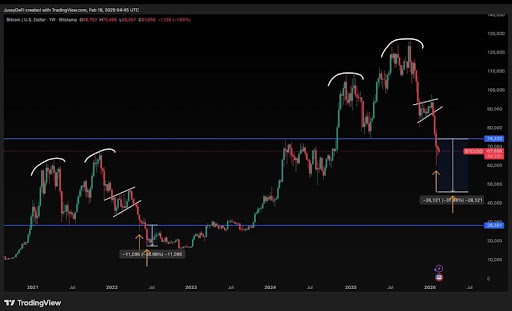
Interestingly, Jussy argues that the current Bitcoin cycle is now reproducing the same bear market structure seen in 2022 almost perfectly. The right side of the chart shows that BTC formed a similar double-top pattern above the $120,000 region in 2025, only to roll over and break down sharply. This correction pushed the price below the key horizontal level near $74,321, which previously acted as support.
Following this drop, Bitcoin entered a consolidation phase that closely resembled the 2022 bear flag. The structure slopes downward, reflecting a major price compression following the first large wick to the downside. According to Jussy, Bitcoin is now in the third week of this consolidation window, the same point in time where the 2022 market transitioned into its final price crash.
The Bottom Target
Using the same percentage decline from the 2022 breakdown, Jussy has predicted how low the Bitcoin price could fall before it attempts a notable recovery. His chart suggests that BTC has already begun its descent from the bear flag pattern, initially crashing below the $100,000 region and now trading near $65,000.
Now, the analyst projects another corrective move of approximately 38% from the former support level around $74,320, potentially driving Bitcoin’s price down to roughly $46,199. The blue line below this zone in the price chart represents Bitcoin’s final downside target. Jussy predicts an even deeper decline to $28,301, marking BTC’s price bottom before any meaningful recovery takes hold.

Featured image created with Dall.E, chart from Tradingview.com

Editorial Process for bitcoinist is centered on delivering thoroughly researched, accurate, and unbiased content. We uphold strict sourcing standards, and each page undergoes diligent review by our team of top technology experts and seasoned editors. This process ensures the integrity, relevance, and value of our content for our readers.